# Install and load drake
install.packages("drake")

# Get an example in a new `main` folder
drake::drake_example("main")

# You can use drake::examples() to see all examplesdrake is an R package by Will Landau that analyzes your workflow. It
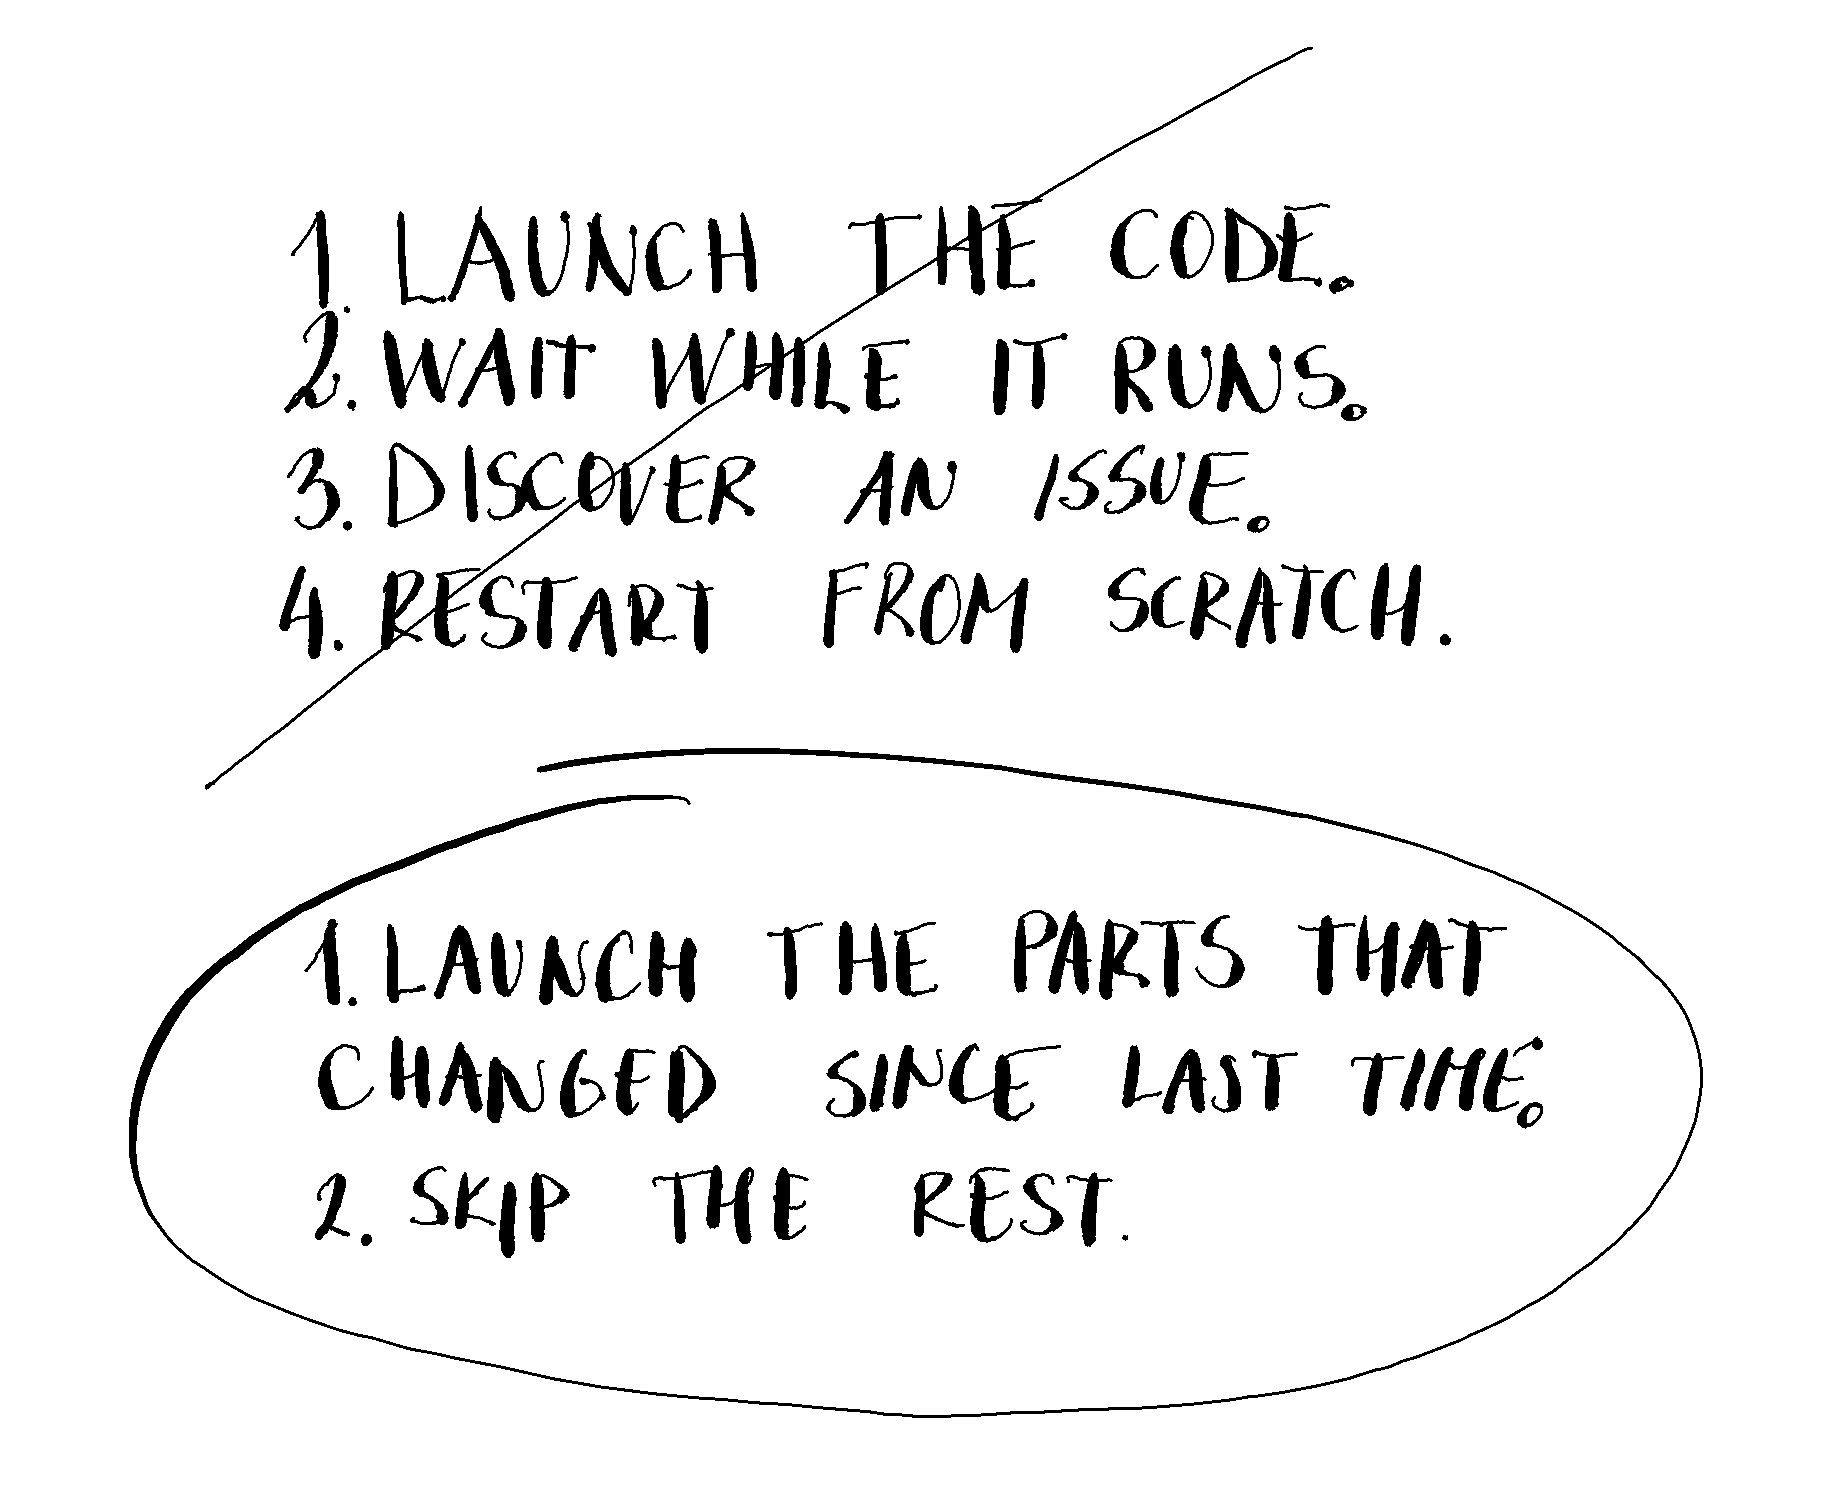
- enables to skip steps of the analysis with up-to-date results;
- provides evidence that results match the underlying code and data;
- encourages good programming practices by modularizing your code into functions1;
- interactively visualizes network representation of your workflow.
drake.Setup
Install drake. You can also load an example written by Kirill Müller. It will appear in a new main folder. I will use it as a showcase for some file examples.
Project structure
It’s suggested that you start your project using this structure2:
make.R
R/
├── packages.R
├── functions.R
└── plan.R
data/
You can also use dflow::use_dflow() to create almost similar structure.
Make
make.R is a master script that
- loads your packages and functions3;
- creates a
drakeplan; - calls
make().
# make.R
source("R/packages.R")  # loads packages
source("R/functions.R") # loads user-defined functions
source("R/plan.R")      # creates drake plan

make(plan)              # defined in R/plan.R
Plan
drake plan is the high-level catalog of data analysis steps (such as data cleaning, model fitting, visualization, and reporting) in a workflow.
Plan is presented as a data frame with columns named target and command.
# plan.R
# The workflow `plan` data frame outlines what you are going to do.
plan <- drake::drake_plan(
  # target, command
  raw_data = readxl::read_excel(file_in("raw_data.xlsx")),
  data = raw_data %>%
    mutate(Species = forcats::fct_inorder(Species)),
  hist = create_plot(data),
  fit = lm(Sepal.Width ~ Petal.Width + Species, data),
  report = rmarkdown::render(
    knitr_in("report.Rmd"),
    output_file = file_out("report.html"),
    quiet = TRUE
  )
)
Drake plan is presented as a data frame with columns named target and command. Each row represents a step in the workflow. Each command is a concise expression that makes use of our functions, and each target is the return value of the command.
See plan object.
knitr::kable(plan)| target | command |
|---|---|
| raw_data | readxl::read_excel(file_in(“raw_data.xlsx”)) |
| data | raw_data %>% mutate(Species = forcats::fct_inorder(Species)) |
| hist | create_plot(data) |
| fit | lm(Sepal.Width ~ Petal.Width + Species, data) |
| report | rmarkdown::render(knitr_in(“report.Rmd”), output_file = file_out(“report.html”), , quiet = TRUE) |
See dependency graph.
drake::vis_drake_graph(plan)Warning: Could not open report.Rmd to detect dependencies.Choose good targets
As Will Landau proposed, a good target is
- long enough to eat up a decent chunk of runtime;
- small enough that
make()frequently skips it; - meaningful to your project;
- an R object compatible with
saveRDS().
Workflow
Even if you use drake, it makes sense to develop interactively. With r_make("make.R")4 you build your project. With loadd and readd you return targets to your session and interactively use them to develop things further.
Basic commands
Here are the most useful commands.
tibble::tibble(
  `function` = c("r_make()", "clean()", "vis_drake_graph()", "code_to_function()", "loadd()", "readd()"),
  description = c("Build your project.", "Force targets to be out of date and remove target names from the data in the cache.", "Show an interactive visual network representation of your workflow.", "Create functions from scripts so you can pass them as commands in drake plan.", "Loads built target(s) into your R session.", "Read and return a built target.")
  ) |>
knitr::kable()| function | description |
|---|---|
| r_make() | Build your project. |
| clean() | Force targets to be out of date and remove target names from the data in the cache. |
| vis_drake_graph() | Show an interactive visual network representation of your workflow. |
| code_to_function() | Create functions from scripts so you can pass them as commands in drake plan. |
| loadd() | Loads built target(s) into your R session. |
| readd() | Read and return a built target. |
You can find more functions in drake README.
For further reading I suggest you The drake R package User Manual. The book also served as a resource for this post.