
What makes poker the most thrilling and painful at the same time? Variance. Everyone can be a winner. But for how long?
A few months ago me and my poker buddies had the debate: ‘What happens with the variance over the increasing hand sample?’ The answer was obvious to everybody, but surprisingly — different. Everyone’s arguments, reasoning, and logic seemed legit. But statistics can be tricky and sometimes, just like in poker, your ‘feeling’ is not enough. So I, the nerdiest guy in the group, decided to show off.
Basics
“Half of the answer lies within a well constructed question,” a wise man once said. If I’m the first to say it, then I’m that wise man. So, let’s break it down. First, the definition of variance: ‘Variance is a number which measures how far a set of numbers is spread out around mean.’ A more useful term is standard deviation which is the square root of the variance. Both represent how swingy your poker results are. But the standard deviation can tell you something more. Let’s get right to a poker example. A hero plays 0 expected value (EV) game with a standard deviation of 100 big blinds per 100 hands (usual standard deviation for no limit Texas hold’ em 6-player cash games). His level of the skill (0 EV) will stay the same through the whole post. Because of this exact standard deviation, there is 68% chance his bankroll will change less than 100 big blinds after 100 hands. But what would happen if the hero played a different number of hands?
Variance of winnings
Let’s start with the obvious one, the variance of winnings. It tells you how much swings you can expect in big blinds or moneywise. But, does it get smaller or bigger with more hands played? Think for yourself but be careful. Your peasant logic can get outplayed by the lady variance. And this time you can’t blame her.
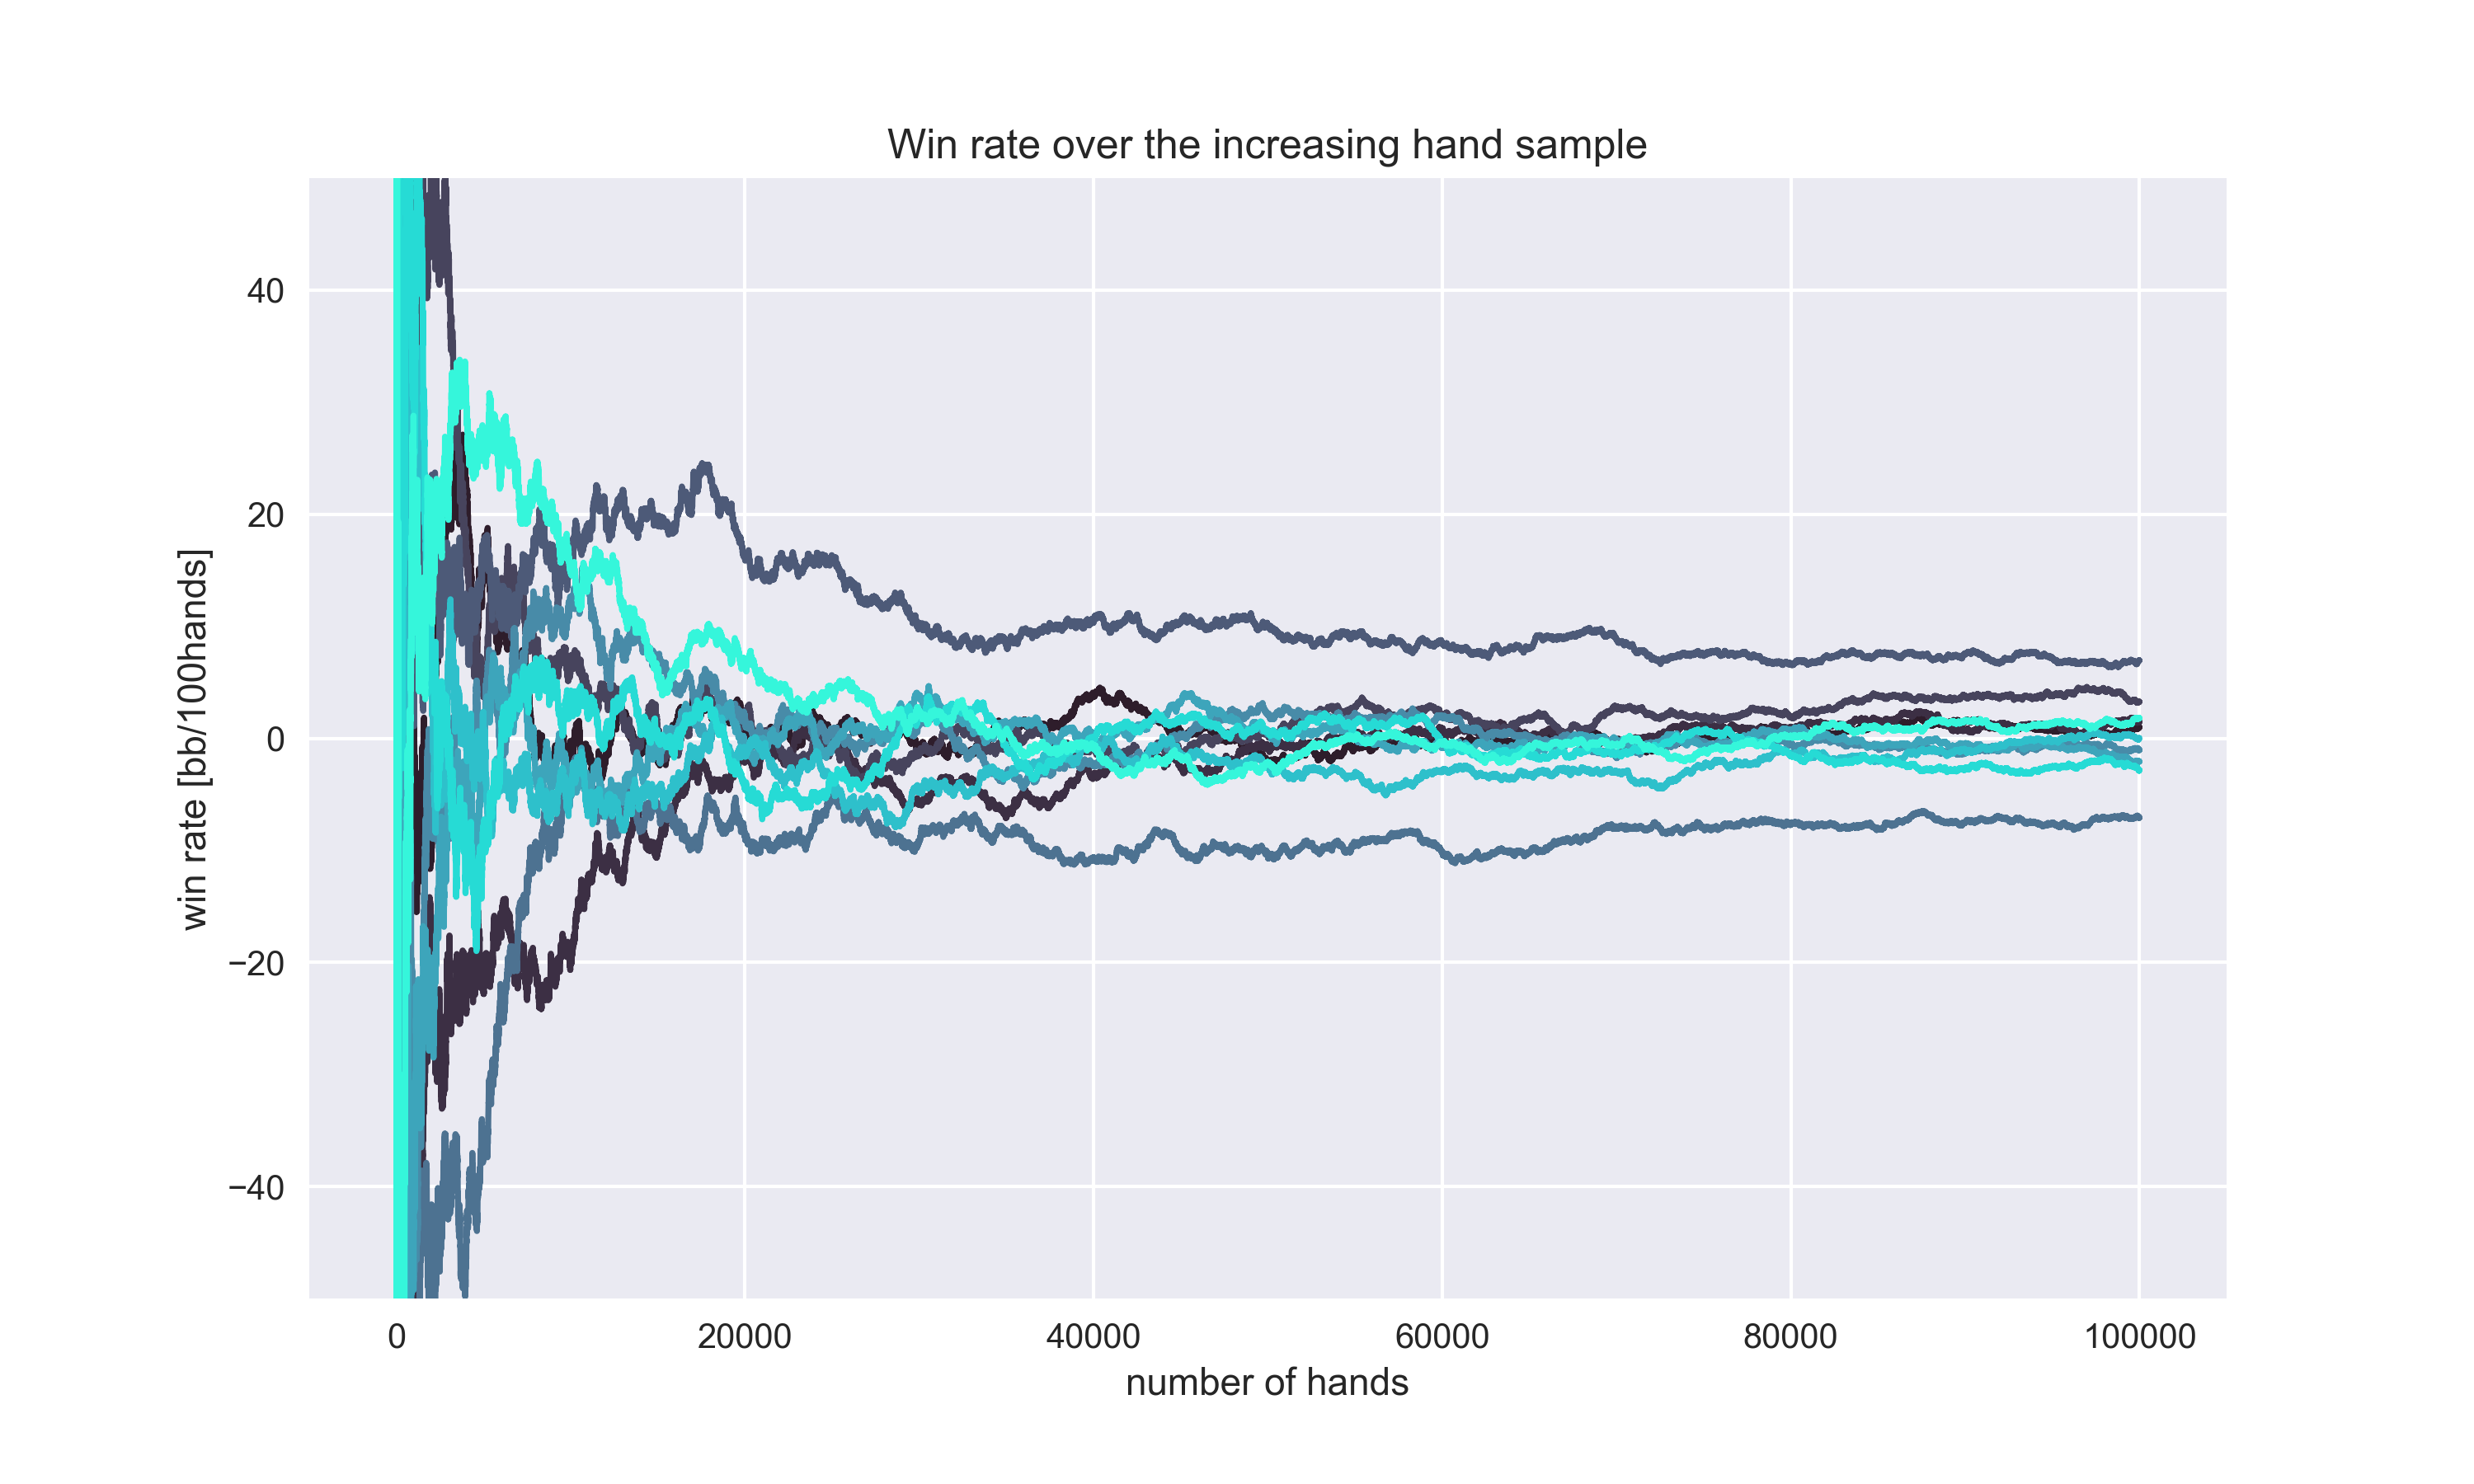
Here are seven different simulated graphs of the hero’s winnings trough 100k hand sample. To make those graphs more understandable you can think about them as graphs of players with the exact same skill level.

It’s kind of hard to believe, those are all simulated graphs of 0 EV player. As you can see, lines are getting more and more dispersed. That means a bigger variance and also standard deviation. If you still have thoughts such as “luck will cancel out at the end of the day”, let me show you another graph. Let’s say the hero plays 1k hands and at the end of a hand sample, he makes a dot of his winnings. Then he goes from scratch again and makes 2k hands. Dot again. Then 3k hands, 4k, 5k… So on, until the 1M hands. Here is what he gets:
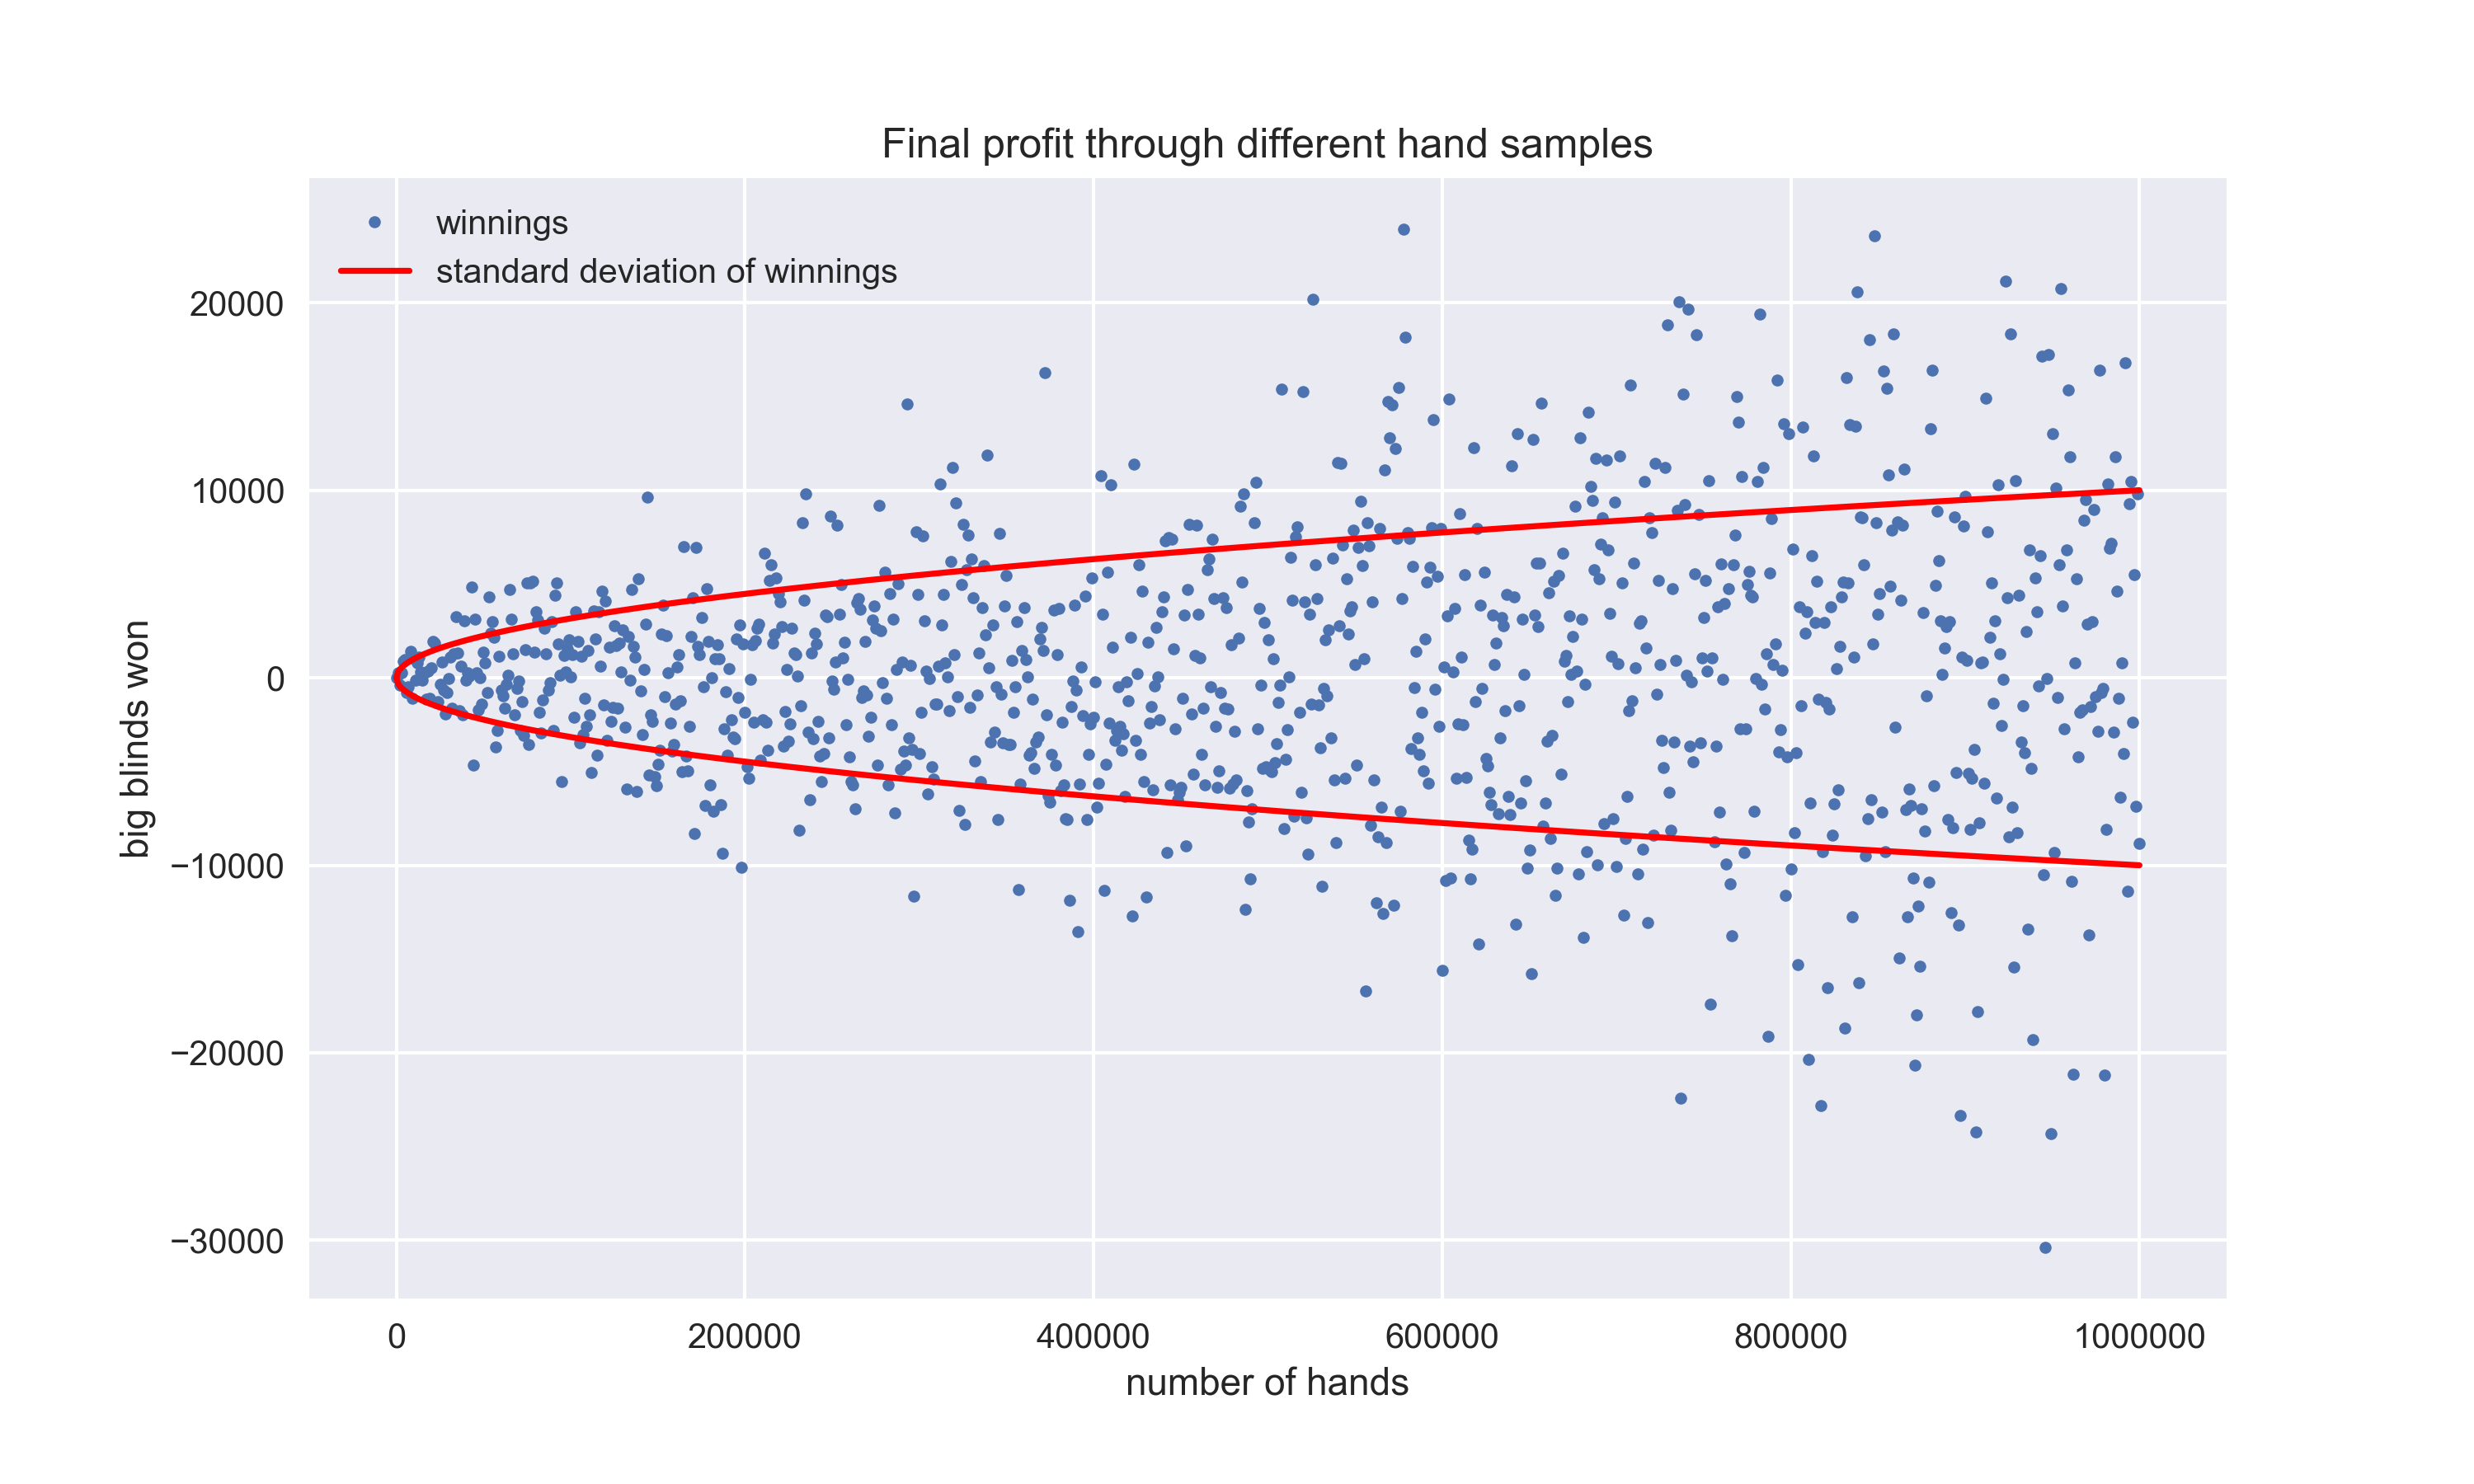
One more time, it gets dispersed. To make things clear, I even displayed a standard deviation line of the winnings. It’s proportional to the square root of a number of hands. The equation for standard deviation is equal to
\(std_{winnings} = K \sqrt(hands)\)
In our case, K is equal to 10.1 For example, if your standard deviation is 85bbs/100hands, the value of K would be 8.5. You can actually calculate a few interesting and useful information from the equation above. You can see that any fixed hand sample has the same standard deviation no matter where on the graph it is located.
Those results are somewhat hard to understand at first sight so let’s bring a few examples, which make ‘logical’ sense:
You can’t win more than one stack in a single hand. If you play more hands, there is a possibility to win more. That tiny portions add to dispersion.
Let’s say you roll a ball in a straight line on the concrete which is not completely flat and has some sand on it. The ball will eventually go out of the line. The longer line it makes, there is the higher chance it will be farther away from the initial line. The last graph represents this situation from bird’s eye perspective.
Before you start playing as little as possible to lower your variance, read on.
Variance of a win rate
This case turns around the whole picture. Win rate is defined as big blinds won divided by a number of hands played. Considering this we get a bit different standard deviation’s equation:
\(std_{winrate} = \frac{100*K}{hands}\)
Actually, something has dramatically changed. The standard deviation now gets smaller trough the increasing hand sample. Let’s just divide the winnings with a number of hands/100 and here is what we get from Graph 1:
Win rates are getting closer to 0 bb/100hands, which is hero’s genuine win rate. Same thing for Graph 2:

Obviously, the more hands you play, the more accurate your win rate should become. Using the second equation we can calculate how many hands you need to lower your standard deviation to 1 bb/100hands. That means, if your win rate is 1bb/100hands, you can be 67% sure your win rate is somewhere between 0 and 2 bb/100hands. And for that, you need 1 million hands. So grind on…
Conclusion
Understanding variance is one of the key factors of becoming a good poker player, especially because of your mental game. You should expect sick things to happen and be capable of facing them. Don’t get too much into those poker software lines. They aren’t as good predictor of your skill as you may think, even the EV line. Just remember — never underestimate the variance and overestimate your poker skill. I wish you all the best at the poker tables.
Footnotes
Where do we get 10? The standard deviation should be 100 per 100 hands. So just insert this in equation you get. 100 = K*sqrt(100). K should be 10. K also represents standard deviation for 1 hand.↩︎